Maybe you will find these theories
criticisable since they tend to turn language into a dead
body which is being studied postmortem... an attempt to carry
out the autopsy of an ever-dying language. You would be right.
However, in the framework of late capitalism, they do play
an ever increasing strategic role and it seemed natural to
give a closer look - if you like to know what fate has in
store for us. The aim of these mathematical and computational
tools is simply to predict our thoughts and behaviours for
commercial or political purposes, a new kind of trend prediction
that plays a crucial role in the optimization of the Adwords
system.
It is also worth to be noted that Shannon's
hobbies were quite interesting conceptually. One of the most
humorous device he built was a box called the "Ultimate
Machine", based on an idea by Marvin Minsky. Otherwise
featureless, the box possessed a single switch on its side.
When the switch was flipped, the lid of the box opened and
a mechanical hand reached out, flipped off the switch, then
retracted back inside the box. In a way the Dadameter is about
the same idea, but at the level of language at the age of
globalisation... as if the cause of language lied in its own
death.
Step 1:
Extracting massive amount of textual information from Google
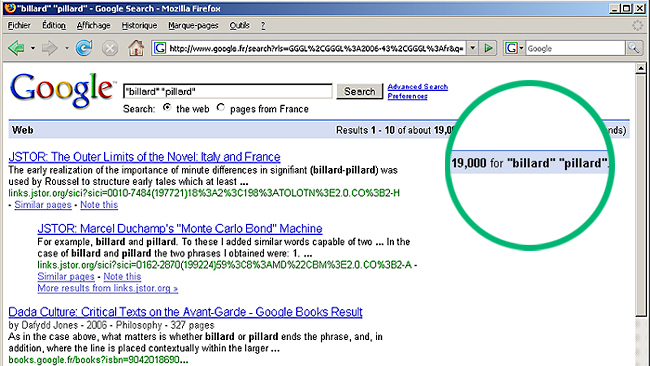
The Dadameter deals with language at large scale and it needs
some of these information Google has in her belly. More precisely,
what we are looking for are the number of pages that contain
two different words, for any two words. These numbers allow
to compute the correlations between two different words, ie.
the probalility to go from one word to the other if we consider
language as a global hypergraph of words and pages. These
numbers are actually given by Google as shown in the picture.
We start by building a list of words. For the present case
we started with a list of about 7000 current english words
(and also some non-english as well as a few surnames). We
have then to extract these figures for about 2.5 millions
couples of words (7000 x 7000 / 2). Since we were mainly interested
in words that look like a bit each other, this quantity is
reduced to about 800 000 couples.
These numbers are given for free by
search engines, however if we need a lot of them, we have
to build a program that scans this huge number of different
pages of a given search engine. If we do that, they detect
us easily and tend to consider our program as a virus, blocking
the IP (as I said these data allow search engines to make
predictions about our behaviour and desires and have a strategic
interest if we consider them in their globality, although
they are worthless taken one-by-one). Therefore we needed
to slow down the scan to make believe the program is actually
a human being searching on the web (and in fact, if you want
to know everything, we did not even use Google but another
search engine, because Google was really too smart in detecting
us. But results are independant of this choice to a large
extent. I keep mentionning Google anyway since it's in the
current language now).
Conceptually this inverse-turing-test
situation is quite interesting, but in practice it considerably
delayed our schedule! It took us about two months to download
all the information we needed, with 5 different computers
connected to the Web with different IP adresses. Search engines
were the first to scan the sum of all the pages of mankind
and now, mankind cannot have access to it's own data! In principle
these data are not property of the search engine, since they
still belong to their authors (each one of us), but the refined
substance that is extracted from this raw material is most
certainly their property, according to the usual laws of capitalistic
societies (one may say this is a co-property but this argument
would probably be ruled out in court).
Step 2: Analyzing this
information using recent breakthroughs in the field of graph
theory in order to understand the large scale structure of
language in terms of homophony and semantics
The information extracted from Google as described above
allow us to classify our couples of words according to semantic
relatedness. As you will see there are mathematical
formulae that allow to do that in the framework of graph theory. But first, remember that our
starting point is Raymond Roussel's work and let's have a
look at the other aspect of the question: homophony, which
is quite easier and well known.
1 - in terms of homophony: Damerau-Levenshtein
distance
The question of homophony within information theory has been
investigated since the 1950's. Damerau-Levenshtein
distance allows to measure the amount of difference between
two sequences (written words) and therefore is a measure of
their homophonic resemblance (not all the question of homophony
is described by this quantity since it stays on the level
of written letters and not real phonetics but it will be enough
for us and matches quite well with the method of Roussel -
although he also made a broader use of homophony). For instance
the Damerau-Levenshtein distance between «billard»
and «pillard» is low (it is 1 according to the
definition below). The Damerau-Levenshtein distance between
«kitten» and «sitting» is 3, since
these three edits change one into the other, and there is
no way to do it with fewer than three edits:
kitten --> sitten
(substitution of 's' for 'k')
sitten --> sittin
(substitution of 'i' for 'e')
sittin --> sitting (insert
'g' at the end)
Precisely, In information theory and computer science, Damerau–Levenshtein
distance is a «distance» (string metric) between
two strings, i.e., finite sequence of symbols, given by counting
the minimum number of operations needed to transform one string
into the other, where an operation is defined as an insertion,
deletion, or substitution of a single character, or a transposition
of two characters.
A first part of our work was then to compute all the Damerau–Levenshtein
distances between the 7000 x 7000 / 2 couples. That was the
easy part.
2 - in terms of semantic relatedness:
Google Similarity distance
Very recentely there have been important progress in the
field of graph theory and quantitative linguistics. A recent
paper from 2005 by Rudi L. Cilibrasi and Paul M.B. Vit´anyi,
has defined a (pseudo-)distance called Google
Similarity Distance (or Normalized Google Distance) that
reflects the semantic relatedness of two words, using information extracted from search
engines (cf Step 1). The
distance between two words is smaller when both words are
closely related, ie. when they tend to appear more often in
the same webpages.
This Normalized Google Distance is actually an improvement
of a simpler and more understandable formula defining the
similarity between two words a and b:
s(a, b) = f(a,b) / sqrt (f(a) x f(b)) = Number of pages containing
both a and b divided by the squareroot of (Number of pages
containing a × Number of pages containing b).
Then d(a, b) = 1 — s(a,b) is the disimilarity between
both words.
This distance depends on the figures that we have extracted
from Google. After having scanned about 800 000 pages of search
results, we were able to get all these quantities for our
7000 words and 800 000 couples of words. Results are impressive
and seem to match quite well with semantic intuition, as it
is argued in the paper by Cilibrasi and Vit´anyi.
3 - in terms of equivocation: clustering
coefficient
An even more complex concept is the clustering coefficient
on a graph. It is interesting for our study because on a semantic
graph, it helps at defining the degree of polysemy of a word,
or equivocation (as it is used by Roussel in his method).
Intuitively if a word belong to two clusters it tends to have
two different meanings. If a word belong to only one cluster,
its meaning will most certainly be univocal.
Recent papers have studied clustering coefficient on a semantic
network, by relating it to the graph
curvature. In our case we had to consider the problem
of an hypergraph and we used in fact a paper from 2007 dealing
with weighted graphs.
Technically we take the minimum of this coefficient for a
given couple of words.
Here, results become very difficult to check and to interprete.
This coefficient is function of the entire neighborhood of
a word and calculating its full value was just impossible
for us. We still lack a lot of information, and we had to
make some approximations whose validity is not very well settled
yet. However we expect that our study shed some lights on
the subject.
At least qualitatively it was important to take this aspect
into account since it is part of Roussel's method and since
it allowed us to conceptualize our approach in terms of map
in an unexpected and interesting way. If you look at the Dadamap
section, the Utilitarianism zone and the Equivocation line,
are directely related to this clustering coefficient (or curvature)
approach.
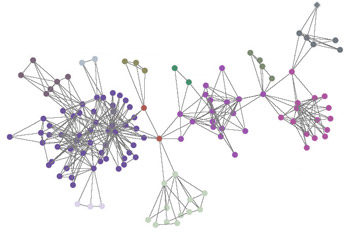
Step 3:
Visualizing these structures with maps, graphs or global
indexes and interpreting the results
We are now in possession of huge lists of numbers and we
need to interprete and visualize this information. This is
a diffcult problem but not hopeless. There are two basic technics
here: self-organizing maps and graphs visualization.
1) A self-organizing map map is a standard
and very helpful technique used for visualizing low-dimensional
views of high-dimensional data by preserving the topological
properties of the high-dimensional initial space. It is generated
with a neural network that gathers together pixels wich are
of similar colours. The model was first described as an artificial
neural network by the Finnish professor Teuvo Kohonen, and
is sometimes called a Kohonen map. Here is an example of a
generation of such a map with a very small set of couples.
At the beginning, coloured pixels are randomly picked and
they organize themselves. In the
Dadamap section you will discover
our interpretation of the different zones, which is the main
result of our study.
2) Finally our data have been
used for building an interactive graph. It is described in
the R.R.Engine section.
|